
The Longmont housing market September 2026 report has the most unusual combination on the Front Range this month: inventory tightened sharply, and homes sold faster — while the median price eased. Longmont was the only one of these four markets where days on market fell.
The Big Picture
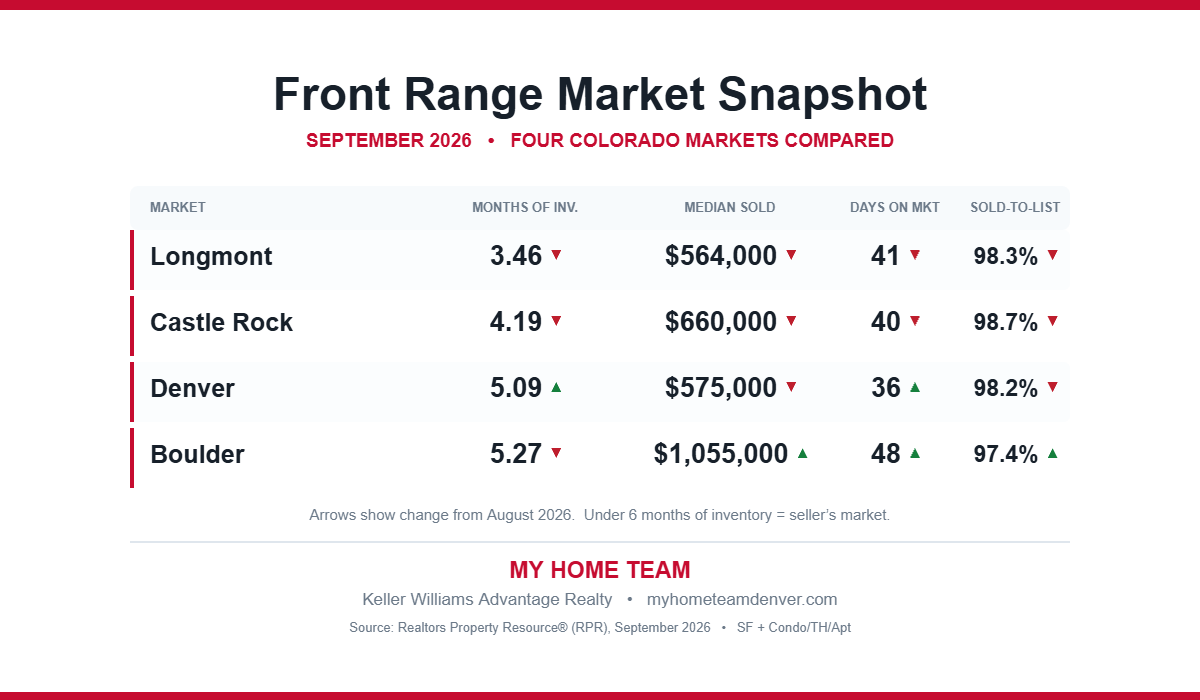
Longmont sits firmly in seller’s market territory with 3.46 months of inventory, down 11.73% from the previous month. Homes sold for 98.3% of list price, down 0.12%, and the median sold price came in at $564,000 — down 3.59%.
The Tightest Inventory on the Front Range — and Getting Tighter
Months supply of inventory fell 11.7% month over month and is down 24.9% year over year. That 11.7% single-month drop is the largest move in either direction among the four markets this month.
At 3.46 months, Longmont again has the lowest supply in this report — well below Castle Rock at 4.19, Denver at 5.09, and Boulder at 5.27.
Active listings fell 13.2% to 429 properties, with total active dollar volume down 6.5% to $458.6M. New listings also pulled back, down 8% to 161 properties.
Homes Sold Faster
The median time a home spent in RPR (Realtors Property Resource) before selling was 41 days, down 10.87% from the prior month. Active listings held steady at a median of 61 days, unchanged month over month.
Longmont was the only market in this report where sold homes moved faster in September than August. Paired with a 13.2% drop in active listings, that points to genuine absorption — buyers are clearing inventory rather than inventory sitting.
New Listings Arrived at Much Higher Prices
New listings numbered 161 properties at a median list price of $649K, up 22.5%, with total volume up 12% to $142.7M and a median living area of 1,942 square feet, up 13%.
That 22.5% jump in new listing prices alongside a 13% jump in size tells you what kind of homes came to market: larger and more expensive than Longmont’s typical inventory. It also explains part of the gap between what is listed and what is closing.
Pending Activity
New pending listings fell 2.8% to 104 properties at a median list price of $567.5K, down 4.6%, with a median of 31 days in RPR. Pending listings overall numbered 113, down 8.9%, at a median list price of $539.9K, down 1.8%, sitting a median of 41 days.
Pending listings preview where closed sales are heading. Longmont’s pending medians sit at or slightly below September’s $564K closing price, so October is unlikely to bring a sharp move in either direction.
Sold Homes
109 homes sold in September, down 6.8%, at a median price of $564K and a sold-to-list ratio of 98.28%, down 0.1%. Total sold volume reached $75.55M, down 1.1%, with median sold price per square foot at $305, up 1.7%.
Note the pairing again: median sold price fell 3.6% while price per square foot rose 1.7%. Smaller homes made up more of September’s closings. The underlying value per square foot moved up, not down.
Property Values Are Essentially Flat
The median estimated property value across Longmont came in at $579,610, down 0.3% for the month and down 0.4% over the past 12 months. Longmont values have been remarkably stable for a full year while transaction volumes swung around them.
What This Means for Buyers and Sellers
For sellers, the fundamentals strengthened. Supply is tighter than anywhere else on the Front Range, homes are selling faster than last month, and the 98.3% sold-to-list ratio is the second highest of the four markets. Do not read the 3.59% median dip as a value decline — price per square foot rose and the valuation model is flat. Plan for about six weeks and price to what is closing, not to the $649K that new listings are asking.
For buyers, selection is the binding constraint. With 429 active listings, down 13.2%, and new listings down 8%, your options narrowed meaningfully in a single month. The upside is value: Longmont’s $327 per square foot on active listings remains far below Boulder at $576. Move decisively when the right home appears — a 41-day median is no longer especially slow.
As always, conditions vary by neighborhood and price point, so working with an agent familiar with the specific submarket remains valuable.
Data source: Realtors Property Resource (RPR), September 2026, based on Longmont, CO listings for single-family, condo, townhome, and apartment properties.
For a look at how the wider metro performed the same month, see our Denver housing market update for September 2026, or compare with Longmont’s August 2026 figures.