
The Castle Rock housing market September 2026 report is the quietest of the four Front Range markets this month — and that is the story. Inventory eased, prices eased, homes sold slightly faster, and sellers kept pulling back on new listings for a second straight month. Nothing dramatic, but every arrow pointed the same direction.
The Big Picture
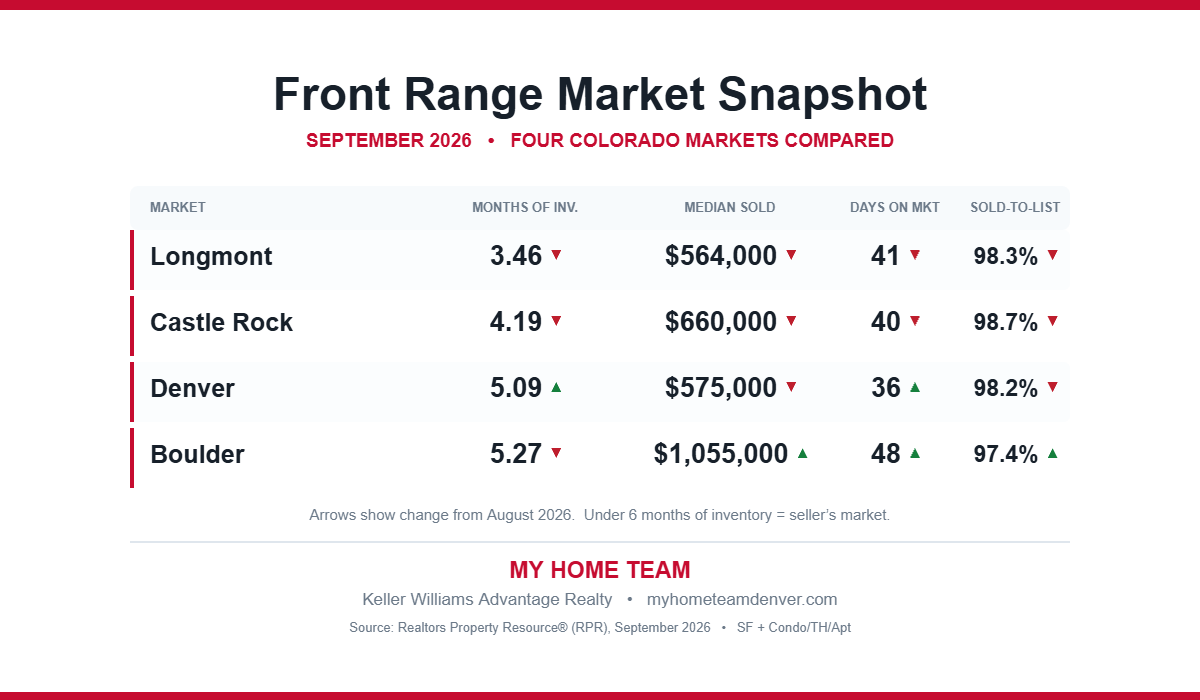
Castle Rock remains in seller’s market territory with 4.19 months of inventory, down 3.01% from the previous month. Homes sold for 98.7% of list price, down 0.04%, and the median sold price came in at $660,000 — down 5.65%.
That 98.7% sold-to-list ratio is the highest of the four markets in this report, and it has now held between 98.5% and 98.7% for three consecutive months.
Inventory Eased After Two Months of Building
Months supply of inventory fell 3% month over month and is down 6.3% compared to twelve months ago. That reverses the direction of July and August, when Castle Rock was the fastest-building inventory market on the Front Range.
Active listings fell 4.9% to 604 properties at a median list price of $725K, unchanged month over month, with total active dollar volume down 3.6% to $581.1M.
New listings fell again, down 10.9% to 180 properties at a median list price of $699.5K, down 3.5%. That is two consecutive months of double-digit declines in new supply after August’s 21.5% drop.
Speed to Sale
The median time a home spent in RPR (Realtors Property Resource) before selling was 40 days, down 2.44% from the prior month. Active listings, however, are sitting a median of 68 days, up 13.3%.
That divergence is worth watching. Homes that sell are moving slightly faster, but the ones that have not sold are aging — the standing inventory is getting staler even as the market clears its more marketable listings.
Pending Activity
New pending listings fell 18.4% to 102 properties at a median list price of $660K, down 7.7%, with a median of 45 days in RPR. Pending listings overall numbered 138, down 10.4%, at a median list price of $737K, down 1.7%, sitting a median of 31 days — down 16.2%.
Pending listings preview where closed sales are heading. The pending median of $737K sits well above September’s $660K closing price, which suggests October closings could come in higher.
Sold Homes
125 homes sold in September, down 9.4%, at a median price of $660K and a sold-to-list ratio of 98.68%, unchanged month over month. Total sold volume reached $105.3M, down 8.8%, with median sold price per square foot at $257, up 1.2%.
Once again the per-square-foot figure moved opposite the headline: median sold price fell 5.65% while $/sqft rose 1.2%. Smaller homes made up more of September’s closings — median living area on sold public records fell 6.8% to 2,677 square feet.
Property Values
The median estimated property value across Castle Rock came in at $679,260, down 0.5% for the month and down 1.7% over the past 12 months — the same gentle drift it has shown all quarter.
What This Means for Buyers and Sellers
For sellers, competition is thinning. Active listings fell 4.9% and new listings dropped 10.9%, so fewer rivals are arriving each month. The 98.68% sold-to-list ratio — the strongest of the four markets — says accurate pricing is still rewarded. But that 68-day median on active listings is your warning: homes that launch above the market are sitting, and they are sitting longer than they were. Price to the $257 per square foot that is actually closing.
For buyers, Castle Rock continues to offer the most space per dollar on the Front Range. At $257 per square foot on sold homes and $275 on active listings, with a median active living area of 2,882 square feet, you are getting substantially more house than in Boulder at $576 per square foot or Denver at $375. With standing inventory averaging 68 days, there is room to inspect thoroughly and negotiate. Watch the pending median at $737K, though — it is running well above closed prices.
As always, conditions vary by subdivision, home size, and whether you are looking at resale or new construction, so working with an agent familiar with the specific submarket remains valuable.
Data source: Realtors Property Resource (RPR), September 2026, based on Castle Rock, CO listings for single-family, condo, townhome, and apartment properties.
For a look at how the wider metro performed the same month, see our Denver housing market update for September 2026, or compare with Castle Rock’s August 2026 figures.