
Last month the Boulder housing market data contained a contradiction: the median sold price fell more than 11%, yet buyers going under contract were committing to prices more than 20% higher. We flagged it as a signal that the headline drop was about which homes happened to close, not about Boulder values. The Boulder housing market September 2026 report settles the question. The median sold price jumped 19.21% to $1,055,000.
The Big Picture
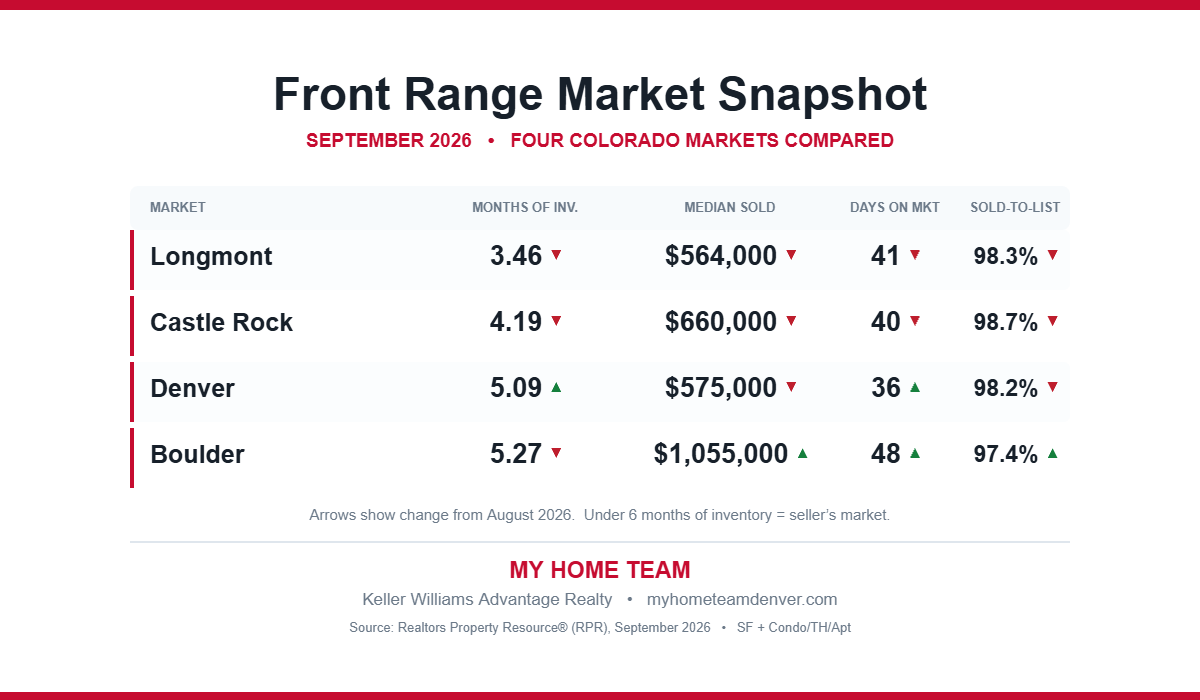
Boulder remains in seller’s market territory with 5.27 months of inventory, down 7.87% from the previous month. Homes sold for 97.4% of list price, up 0.16%, and the median sold price came in at $1,055,000 — up 19.21%.
That is the first time in this reporting series that Boulder’s median sold price has crossed the million-dollar line.
Inventory Is Down 29.8% Year Over Year
Months supply of inventory fell 7.9% month over month and is down 29.8% compared to twelve months ago. Boulder’s supply has contracted in every month we have tracked this year.
Active listings fell 8.6% to 701 properties, with total active dollar volume down 7.8% to $1.13B. New listings, by contrast, rose 11.9% to 245 properties at a median list price of $985K, up 6%, with total new listing volume up 31.8% to $380.5M.
So sellers did come to market in September — and at higher prices — but not fast enough to offset the pace of sales.
Speed to Sale
The median time a home spent in RPR (Realtors Property Resource) before selling was 48 days, up 2.13% from the prior month. Active listings are sitting a median of 69 days, up 1.5%.
Boulder continues to have the longest timelines among the Front Range markets we track, which is what a near-seven-figure median produces. The buyer pool at that price point is smaller and more deliberate.
Sold Homes
121 homes sold in September, up 16.3%, at a median price of $1.06M and a sold-to-list ratio of 97.38%, up 0.2%. Total sold volume reached $151.6M, up 16.1%, with median sold price per square foot at $578, up 12.7%.
This is the detail that confirms the trend. Sales count rose, volume rose, and price per square foot rose 12.7%. When the median price, the transaction count, and the per-square-foot figure all move up together, that is broad strength rather than a quirk of the mix.
Pending Activity Points Higher Still
New pending listings rose 1.8% to 111 properties at a median list price of $1.18M, up 7.3%. Pending listings overall numbered 116, down 10.8%, at a median list price of $1.22M, up 11.4%, with median living area up 21.7% to 2,298 square feet.
Both pending measures sit above September’s $1.06M closing median, and pending median days in RPR jumped 76.5% to 60 — larger, more expensive homes are working through the pipeline. October closings could land higher again.
Property Values
The median estimated property value across Boulder came in at $979,490, down 0.6% month over month but up 0.6% over the past 12 months. Boulder remains the only market in this report with a positive twelve-month value change.
Worth separating the two figures: the valuation model covers Boulder’s entire housing stock and is essentially flat, while the sold median reflects the specific homes that transacted. September’s buyers skewed toward the upper end.
What This Means for Buyers and Sellers
For sellers, this is the strongest month Boulder has posted in this series. Inventory is down 29.8% year over year, sales volume is rising, and price per square foot is up 12.7%. If you have been waiting for evidence that Boulder values held through the summer, this is it. Still, budget seven weeks or more: the 48-day median and 97.38% sold-to-list ratio mean this is a market that rewards patience and accurate pricing, not aggressive asks.
For buyers, the window that looked open in August is closing. Inventory fell again, pending prices are above closing prices, and per-square-foot values rose sharply. The compensation is time — 48 days on market gives you room to inspect and negotiate without being rushed into a decision.
As always, conditions vary significantly by neighborhood and price point. A condo near Pearl Street and a single-family home in Table Mesa are effectively different markets, so working with an agent familiar with the specific submarket remains valuable.
Data source: Realtors Property Resource (RPR), September 2026, based on Boulder, CO listings for single-family, condo, townhome, and apartment properties.
For a look at how the wider metro performed the same month, see our Denver housing market update for September 2026, or revisit Boulder’s August 2026 figures where this shift was first signalled.